
Most segmentation is fiction. Companies divide their market by demographics, age, geography, company size, job title, and call the result a strategy. The segments get names ("Enterprise Decision-Makers," "Millennial Professionals," "Mid-Market IT Directors") and are presented in a deck with colour-coded pie charts and an air of scientific authority. The problem is that demographics do not explain purchasing behaviour. Two thirty-five-year-old marketing directors in San Francisco can have entirely different pain points, urgency levels, budget authority, and willingness to pay. One is drowning in manual processes and would pay almost anything for automation. The other has already solved that problem and is looking for something else entirely. They occupy the same demographic segment. They require completely different sales conversations.
The segments that actually drive revenue are defined not by who people are, but by what they struggle with. Need-based segmentation, attitudinal segmentation, behavioural segmentation: these are the approaches that separate companies with sharp go-to-market execution from companies spending money on campaigns that feel vaguely correct but convert poorly. The difficulty is that discovering these segments requires research. And research, traditionally, means thirty to sixty interviews, six to twelve weeks of fieldwork, and a consultancy bill between $20,000 and $80,000. Most companies skip it. They guess. They segment by demographics because the data is readily available, not because it is meaningful.
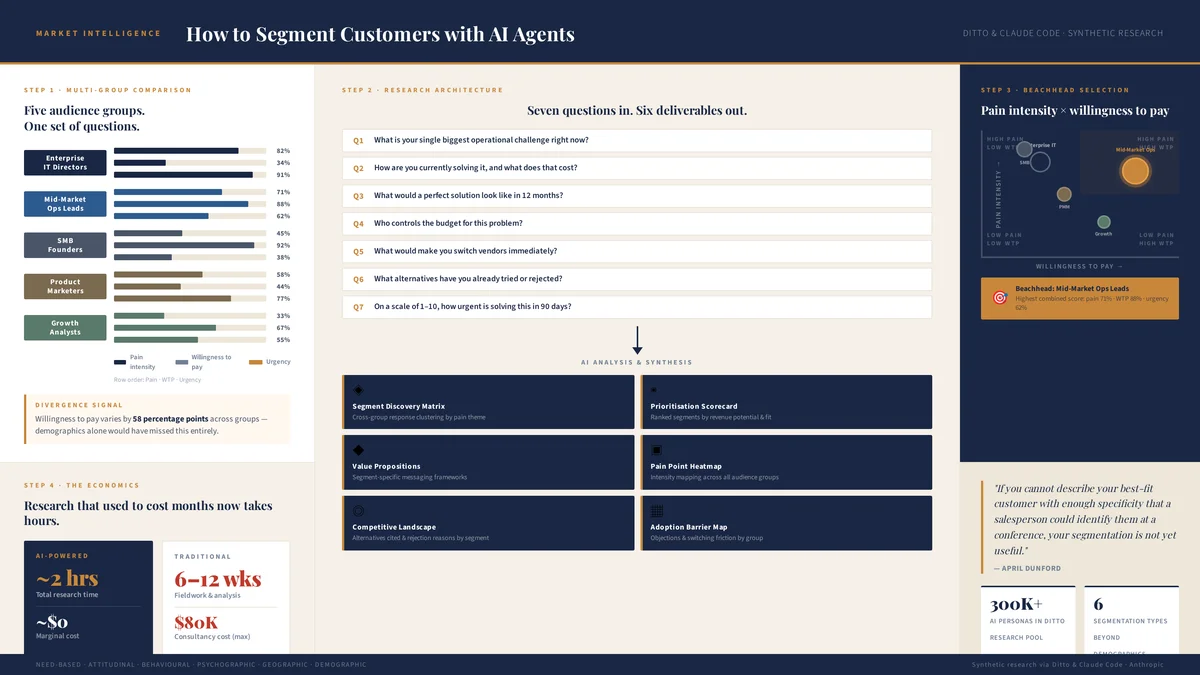
This article describes a faster approach. Using Ditto, a synthetic market research platform with over 300,000 AI personas, and Claude Code, Anthropic's agentic development environment, you can run a structured segmentation study in under an hour. Create multiple research groups with different demographic filters, ask identical questions to each, and compare the responses. The divergences reveal your real segments. The convergences tell you what is universal. And the whole exercise costs a fraction of what a single focus group would run you.
The Expensive Fiction of Demographic Segmentation
Geoffrey Moore's Crossing the Chasm introduced the concept of the beachhead segment: a narrowly defined group of customers with a specific, urgent problem that your product solves better than any alternative. The beachhead is not "small businesses" or "enterprise companies." It is, to use Moore's own example, something closer to "department heads in mid-sized financial services firms who need to automate regulatory compliance reporting and currently rely on spreadsheets." That level of specificity requires understanding the problem, the context, and the alternatives, not merely the demographics.
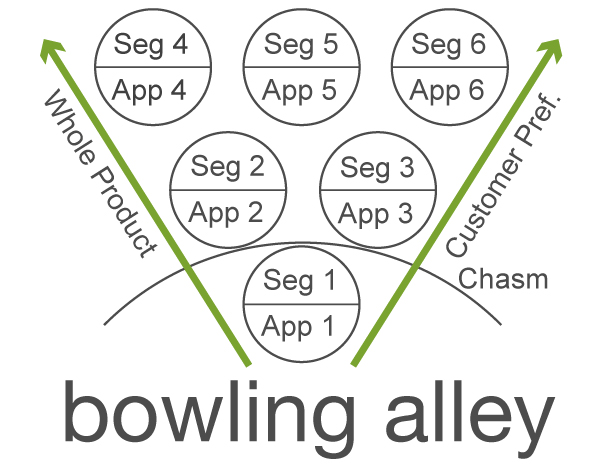
Geoffrey Moore's bowling alley strategy: target a beachhead segment, then expand into adjacent niches sequentially. Source: Ignition Framework.
The cost of wrong segmentation is not abstract. It manifests as spray-and-pray marketing: campaigns that target broad demographics and convert at one or two percent because the message resonates with a sliver of the audience and bounces off the rest. It manifests as misallocated sales effort: reps pursuing leads that match the demographic profile but lack the pain intensity that drives purchasing urgency. It manifests as generic messaging that tries to speak to everyone and consequently speaks to nobody. April Dunford puts it crisply: if you cannot describe your best-fit customer with enough specificity that a salesperson could identify them at a conference, your segmentation is not yet useful.
The traditional remedy is qualitative research. Commission a segmentation study. Recruit thirty to sixty participants across your target market. Conduct hour-long interviews. Transcribe, code, and analyse the transcripts. Identify clusters. Name the segments. Build personas. Present findings. The process takes six to twelve weeks, costs $20,000 to $80,000 depending on the scope, and produces a deliverable that is out of date within a quarter because markets move faster than research programmes. Most product marketing teams, being honest about their constraints, substitute intuition for research and hope the intuition is good.
Six Types of Segmentation, and Why Most Companies Stop at Two
Before running a segmentation study, it helps to understand what kinds of segments exist. The taxonomy is well established, but most companies only use the first two types because they are the easiest to operationalise with available data.
1. Demographic Segmentation
Age, gender, income, education, occupation. The oldest and most accessible form of segmentation. Useful for broad media buying (television audiences, social media targeting) but rarely sufficient for product marketing because it treats correlation as causation. Women aged 25 to 34 are not a segment. Women aged 25 to 34 who are frustrated with existing project management tools and willing to pay a premium for something better might be.
2. Geographic Segmentation
Country, region, city, climate, urban versus rural. Necessary for companies operating across markets with different regulatory environments, cultural norms, or distribution channels. A food brand launching in the UK and the US genuinely faces different segments. But geography alone does not explain why two customers in the same city buy differently.
3. Psychographic Segmentation
Values, attitudes, lifestyle, personality traits. This is where segmentation begins to get interesting. A psychographic segment might be "early adopters who value innovation over stability and are willing to tolerate a rough product if the vision is compelling." The difficulty is measurement: psychographic data requires asking people what they believe, not merely observing what they do. Surveys and interviews are the traditional instruments. Ditto's synthetic personas, with their psychographic profiles, offer an alternative.
4. Behavioural Segmentation
Purchase frequency, usage patterns, brand loyalty, occasion-based buying. Behavioural segments are powerful because they describe what people actually do, not what they say they do. A "power user" segment defined by daily active usage and feature adoption tells you more about retention risk and expansion revenue potential than any demographic profile. The challenge is that behavioural data requires an existing customer base, which makes it less useful for new products or new markets.
5. Need-Based Segmentation
What problem are they solving? How intensely do they feel it? What alternatives have they tried? Need-based segmentation is the foundation of product-market fit analysis and the most directly actionable form of segmentation for product marketers. Two customers in the same demographic with different need intensities will respond to entirely different messaging, pricing, and product configurations. Pragmatic Institute's framework centres need-based segmentation as the core of market strategy.
6. Firmographic Segmentation (B2B)
Company size, industry, revenue, technology stack, growth stage. The B2B equivalent of demographic segmentation, and equally insufficient on its own. A Series A fintech startup and a Series A healthcare startup have the same firmographic profile but completely different procurement processes, regulatory constraints, and pain points. Firmographic data tells you who might buy. It does not tell you who will.
The real insights come from layering. "US women aged 30 to 45" is demographic. "US women aged 30 to 45 who are frustrated with current solutions and willing to pay a premium for something that integrates with their existing workflow" is actionable. The layering of demographic, psychographic, and need-based criteria is what transforms a market description into a targeting strategy. The Ditto segmentation workflow is designed to discover these layered segments through comparative research rather than assumption.
The Seven-Question Segmentation Study
The core technique is disarmingly simple: ask the same seven questions to multiple groups and compare the answers. The divergences reveal your segments. The convergences reveal universal truths. The method works because segmentation is fundamentally a comparison exercise. You cannot identify what makes a group distinctive without a reference point.
Claude Code customises the questions with your product details, category, and competitive landscape, then runs the study through Ditto's API against ten personas per group. Here is the question design, and why each question matters for segmentation specifically.
Question 1 (Problem Awareness and Pain Intensity): "What is your biggest frustration with [category/current approach]? How much does this problem affect your daily work or life?"
This is the segmentation signal with the highest predictive power. Pain intensity separates buyers from browsers. A group that describes the problem as a mild inconvenience will behave entirely differently from a group that calls it a daily source of stress. When you ask this question across three demographic groups and one reports intense pain while the others report mild annoyance, you have found your beachhead. The group with the highest pain intensity is your most addressable market because urgency drives purchasing velocity. They are not shopping. They are searching.
Question 2 (Current Behaviour and Competitive Landscape): "How do you currently deal with this problem? What tools, services, or workarounds do you use? What do you like and dislike about them?"
Current behaviour reveals competitive positioning opportunities that vary by segment. One group may rely on spreadsheets and manual processes (indicating a greenfield opportunity with low switching cost). Another may be locked into an enterprise platform they dislike but cannot leave (indicating a displacement opportunity with high switching cost and different messaging requirements). A third may have cobbled together a stack of point solutions that sort of work (indicating an integration or consolidation opportunity). Each pattern demands a different go-to-market approach. Without this question, you are guessing which competitive position to take.
Question 3 (Resonance Test): "If a product could [core value proposition], how interested would you be? What would make you trust that claim?"
This is the most important segmentation signal in the study. The resonance test measures the gap between the problem (Question 1) and your proposed solution. When interest is high but trust is low, you have a segment that needs proof: case studies, demonstrations, pilot programmes. When interest is moderate but trust is high, you have a segment that needs urgency: why now, what they are losing by waiting. When interest is low across the board, you may be solving the wrong problem for that group. The trust dimension is particularly revealing: different segments require different evidence. Enterprise buyers want references. Startup founders want speed. Consumer buyers want social proof.
Question 4 (Urgency and Consequence of Inaction): "What happens if you do not solve this problem in the next six months? What are the consequences of doing nothing?"
Urgency is the accelerant that converts interest into action, and it varies dramatically by segment. A segment facing regulatory deadlines has external urgency that is non-negotiable. A segment losing market share has competitive urgency that is self-imposed. A segment that describes the consequence of inaction as "we'd muddle through" has no urgency at all, and no amount of clever marketing will create it. This question separates the segments worth pursuing now from those worth nurturing for later. It also surfaces the language of consequence: the specific phrases that belong in your sales scripts and ad copy because they describe what the customer stands to lose.
Question 5 (Willingness to Pay): "What would you expect to pay for a solution that [solves the problem described]? At what price would you say 'that is too expensive'?"
Price sensitivity is one of the most reliable segment discriminators. When two groups express similar pain intensity but different willingness to pay, you have discovered a segmentation boundary with direct commercial implications. The group willing to pay more is typically dealing with higher-stakes consequences (the cost of the problem exceeds the cost of the solution by a wide margin) or has fewer alternatives. The group with lower willingness to pay may still be a viable segment, but it requires a different pricing and packaging strategy. This question pairs naturally with a dedicated pricing study once you have identified which segments to price for.
Question 6 (Feature Priorities and Purchase Criteria): "Which of these capabilities matters most to you? [Feature list]. What would be a dealbreaker if it were missing?"
Feature priorities diverge sharply across segments, and the divergence pattern is a segmentation map in itself. When one group prioritises ease of use and another prioritises depth of functionality, you have discovered a fundamental tension that cannot be resolved with a single product configuration. This question also reveals dealbreakers: the features whose absence disqualifies a solution entirely. Dealbreakers tend to be segment-specific. Enterprise buyers may require SSO and audit logs. Consumer buyers may require mobile access. Startup founders may require API access. Each dealbreaker defines a segment boundary that your product roadmap must respect.
Question 7 (Adoption Barriers and Trust Signals): "What would prevent you from trying a new solution in this space? What would you need to see or hear before you felt confident switching?"
Adoption barriers are the mirror image of purchase criteria, and they segment the market along a dimension that most companies neglect: risk tolerance. A segment with high pain and high risk aversion (typically enterprise buyers or regulated industries) requires extensive proof, pilot periods, and guarantees before committing. A segment with high pain and low risk aversion (typically startups or individual professionals) will try anything that might work and evaluate through usage. The trust signals requested by each segment become the content strategy for that segment: whitepapers and case studies for the risk-averse, free trials and quick wins for the adventurous.
Multi-Group Comparison: Where the Segments Emerge
The fundamental method is to create three to five Ditto research groups with different demographic or psychographic filters, ask identical questions, and compare responses. Claude Code orchestrates this automatically, running parallel studies and producing a divergence analysis that highlights where groups agree (universal truths) and where they differ (segment boundaries).
B2C Example: Consumer Product Launch
Imagine you are launching a premium meal delivery service and need to identify which consumer segment to target first. You create three research groups:
Group 1: Young professionals (age 22 to 32, employed, urban). Time-poor, health-conscious, digitally native. Likely to discover the product through social media or influencer content.
Group 2: Mid-career parents (age 33 to 48, employed). Time-poor for different reasons (children), value convenience and nutrition, more price-sensitive because household budgets are stretched across more categories.
Group 3: Older consumers (age 50 to 65). Potentially more health-motivated, less price-sensitive, less likely to adopt a digitally native brand without social proof or traditional media exposure.
Same seven questions. Three audiences. The results might reveal that Group 1 has moderate pain ("I order takeaway too often, I know it is unhealthy") but low willingness to pay for a premium service because discretionary spending is tight. Group 2 has intense pain ("I spend ninety minutes every evening on dinner and the kids still complain") and moderate willingness to pay because the time saved has measurable value. Group 3 has low pain intensity but high willingness to pay because they can afford it and are motivated by health outcomes rather than convenience.
The beachhead is Group 2. Not because they are the largest market, but because they have the highest combination of pain intensity and willingness to pay. Their pain is specific, daily, and emotionally charged. Their current solutions (cooking from scratch, mediocre ready meals, sporadic takeaway) are unsatisfying. Their urgency is built-in: they deal with this problem every single evening. The messaging for this group should lead with time recovery, not health optimisation. The pricing can be premium because the value proposition is time, which this segment values more than money.
B2B Example: SaaS Product Expansion
Now consider a B2B scenario. You have a workflow automation tool and want to understand which buyer persona to prioritise in your next quarter's pipeline. Three groups:
Group 1: Startup founders and COOs (age 28 to 42, employed). Running lean teams, wearing multiple hats, desperate for anything that saves time. Likely to adopt quickly, unlikely to have complex procurement processes.
Group 2: Mid-market VPs of Operations (age 35 to 50, employed). Managing teams of twenty to two hundred, dealing with process inefficiencies that scale with headcount. Budget authority exists but requires justification.
Group 3: Enterprise Directors of Digital Transformation (age 40 to 58, employed). Leading large-scale change programmes, managing multiple stakeholders, operating within procurement frameworks that add months to purchasing cycles.
The divergence map is where the magic happens. Group 1 might show the highest pain intensity but the lowest willingness to pay (startup budgets). Group 2 might show moderate pain but the clearest articulation of ROI ("this costs us three FTEs worth of wasted time per month"). Group 3 might show the lowest urgency ("we have a transformation roadmap that extends to 2028") but the highest deal value. Your beachhead decision depends on your business model: if you need volume and speed, target Group 1. If you need revenue efficiency, target Group 2. If you need anchor customers for credibility, target Group 3.
The study does not make the decision for you. It makes the decision informed. Without it, the team argues about which segment to prioritise based on anecdote and assumption. With it, the argument is grounded in comparative data about pain intensity, willingness to pay, competitive landscape, and adoption barriers across all three groups.
Six Deliverables from a Segmentation Study
A completed multi-group study yields seventy qualitative responses per group across seven questions. Claude Code analyses the comparative data and produces six deliverables, each serving a different team and strategic function.
Segment Discovery Matrix. A comparison grid showing how each group responded to each question, with divergences highlighted. This is the raw material for identifying segment boundaries. Where groups give similar answers, you have a universal truth. Where they diverge sharply, you have a segment boundary worth investigating.
Segment Prioritisation Scorecard. Each segment scored on pain intensity, willingness to pay, urgency, competitive saturation, and adoption barriers. The aggregate score provides a quantified basis for beachhead selection. This is the deliverable that resolves the "which segment first" debate with data rather than opinions.
Segment-Specific Value Propositions. For each identified segment, a tailored value proposition that leads with the pain, competitive alternative, and outcome language that resonated in the study. These feed directly into positioning validation and messaging testing workflows.
Pain Point Heatmap. A visual representation of which pain points are universal across segments and which are segment-specific. Universal pain points belong in your homepage messaging. Segment-specific pain points belong in targeted campaigns, nurture sequences, and sales conversations.
Competitive Landscape by Segment. Each segment's competitive alternatives, mapped and compared. One segment may compete primarily against manual processes (greenfield). Another may compete against an entrenched incumbent (displacement). A third may compete against a constellation of point solutions (consolidation). Each competitive landscape requires a different battlecard strategy.
Adoption Barrier Map. The specific objections, concerns, and trust requirements for each segment, ranked by frequency and intensity. Sales enablement teams use this to prepare objection-handling playbooks. Product teams use it to prioritise trust-building features (security certifications, integrations, data portability). Marketing teams use it to design content that addresses barriers before they become objections.
Advanced: Behavioural Segmentation Within a Demographic Group
The multi-group comparison described above uses demographic filters to create initial groups. This is the discovery phase: casting a wide net to identify where the meaningful divergences lie. But the most actionable segmentation often happens in the second round, when you drill into the most promising demographic group and segment it behaviourally.
Here is how the two-round approach works.
Round 1 reveals that mid-career parents (Group 2 in the meal delivery example) are your beachhead: highest pain, strongest willingness to pay, most emotionally charged language about the problem. But within that group, not all parents are the same. Some cook every night and resent the time. Others alternate between cooking and takeaway and feel guilty about the inconsistency. A third subset has already tried meal kits and found them insufficient. These are behavioural sub-segments within a demographic group, and they require different messaging, different onboarding experiences, and possibly different pricing.
Round 2 tests behavioural hypotheses. You create three new Ditto research groups, all within the mid-career parent demographic, but with adjusted prompts or questions designed to surface behavioural differences:
Sub-group A: "Reluctant cooks" who cook daily but view it as a chore. Their pain is time. Their trigger is anything that credibly reduces weeknight cooking time.
Sub-group B: "Guilt cyclers" who alternate between effort and shortcuts and feel bad about both. Their pain is cognitive load and inconsistency. Their trigger is a solution that removes the decision fatigue.
Sub-group C: "Upgrade seekers" who have tried meal kits or ready meals and found them wanting. Their pain is quality. Their trigger is a demonstrably better product, not merely a more convenient one.
Same seven questions, asked to all three sub-groups. The divergences within the beachhead reveal which sub-segment to target first, what messaging to use, and what product experience to prioritise. The reluctant cooks want speed claims. The guilt cyclers want permission messaging ("it is okay to not cook every night"). The upgrade seekers want quality proof and ingredient sourcing stories.
This two-round structure, demographic discovery followed by behavioural refinement, is the closest synthetic research gets to the depth of a traditional qualitative segmentation study. The difference is timeline: traditional takes twelve weeks, this takes two hours.
Where Segmentation Fits in the PMM Stack
Segmentation is upstream of everything. It is the decision that determines who you target, which in turn determines every subsequent strategic choice. The sequence runs:
Segmentation (this article) identifies your best-fit customer segments: who has the most pain, who will pay, who can you reach, who should you target first. Without segmentation, every downstream decision is a guess about audience.
Positioning validation establishes how you position for your chosen segment. Positioning without segmentation is positioning for everyone, which is positioning for nobody. The competitive alternatives, unique attributes, and value proposition all depend on who you are talking to.
Messaging testing validates how to communicate your value to the target segment. The language that resonates with startup founders is different from the language that resonates with enterprise directors. Segmentation tells you which language to test.
Pricing research validates what your target segment will pay. The willingness-to-pay data from the segmentation study provides the starting hypothesis. The dedicated pricing study refines it with specific price points, packaging options, and competitive anchors.
Voice of Customer research keeps your understanding of the target segment current. Segments drift. Pain points evolve. Competitors enter and exit. VoC provides the ongoing signal that keeps your segmentation fresh.
GTM strategy validation translates segment insights into channels, motions, and tactics. The segmentation study tells you who to reach. The GTM validation tells you how to reach them.
With Ditto and Claude Code, a complete segmentation study, including multi-group comparison and one round of behavioural refinement, can be completed in under two hours. The strategic thinking between rounds is as important as the research itself. But removing the research bottleneck means the thinking happens whilst the market is current rather than months later when the landscape has shifted and the team has already committed to a direction based on assumptions.
Limitations and Where Traditional Methods Still Win
Synthetic segmentation research excels at discovery and hypothesis generation. It tells you where the segment boundaries likely lie, which segments have the most pain, and which are worth investigating further. It produces this signal in hours rather than months, and for a fraction of the cost.
What it cannot do is provide real purchasing behaviour data. Synthetic personas report what they would do, not what they have done. The correlation is strong, validated at ninety-five percent by EY Americas and in studies at Harvard, Cambridge, and Oxford, but stated intent and revealed behaviour are not identical. A persona that says "I would pay $50 per month" is directionally reliable. A cohort analysis of actual customers paying $50 per month is definitive.
Similarly, synthetic segmentation cannot track actual conversion rates by segment, measure real churn patterns, or observe longitudinal segment drift through usage data. These require product analytics, CRM data, and customer success metrics from a live business. The segmentation study tells you which segments are worth building for. Your own data tells you whether the segments behave as predicted.
The recommended approach is sequential. Use Ditto for fast first-pass discovery: identify the segments, prioritise the beachhead, generate segment-specific hypotheses about messaging, pricing, and channel strategy. Then validate the beachhead segment with real customers. Run a small pilot. Measure actual conversion and retention. Confirm that the segment identified through synthetic research behaves in practice as the personas predicted. The synthetic study sets the direction in two hours. The real-world validation confirms it over two to four weeks. Together, they produce a segmentation strategy grounded in both breadth of coverage and depth of evidence.
Getting Started
If you have ever sat in a meeting where someone said "our target customer is marketing managers at mid-sized companies" and everyone nodded, you have experienced the fiction of demographic segmentation. It feels specific. It is not. It describes a job title and a company size. It says nothing about pain, urgency, willingness to pay, competitive alternatives, or adoption barriers. It is a targeting parameter, not a segment.
Ditto provides the always-available research panel. Claude Code handles the orchestration: creating three to five research groups with different demographic filters, running the identical seven-question study against each, analysing the comparative responses, and producing the six deliverables listed above. The customer segmentation guide walks through the full workflow, including the behavioural refinement round and the deliverable generation process.
Moore's beachhead concept is nearly four decades old. Dunford's insistence on specificity is a decade old. The frameworks are not new. What is new is the ability to execute them in an afternoon rather than a quarter. The question is no longer whether you can afford to do proper segmentation research. It is whether you can afford to keep guessing.
The AI Agents for Product Marketing Series
Series Overview: Using Ditto and Claude Code for Product Marketing
Part 1: How to Validate Product Positioning (guide)
Part 2: How to Build Competitive Battlecards (guide)
Part 3: How to Research Pricing (guide)
Part 4: How to Test Product Messaging (guide)
Part 5: How to Run Voice of Customer Research (guide)
Part 6: How to Segment Customers with Claude Code and Ditto (guide) — this article
Part 7: How to Validate GTM Strategy (guide)
The Claude Code and Ditto for Product Marketing Series
This article is part of a series on using Claude Code and Ditto for product marketing. Each article explains a specific workflow; each has a corresponding Claude Code technical guide for hands-on implementation.
Part 1: How to Validate Product Positioning with Claude Code and Ditto | Claude Code Guide
Part 2: How to Build Competitive Battlecards with Claude Code and Ditto | Claude Code Guide
Part 3: How to Research Pricing with Claude Code and Ditto | Claude Code Guide
Part 4: How to Test Product Messaging with Claude Code and Ditto | Claude Code Guide
Part 5: How to Run Voice of Customer Research with Claude Code and Ditto | Claude Code Guide
Part 6: How to Segment Customers with Claude Code and Ditto (this article) | Claude Code Guide
Part 7: How to Validate GTM Strategy with Claude Code and Ditto | Claude Code Guide