
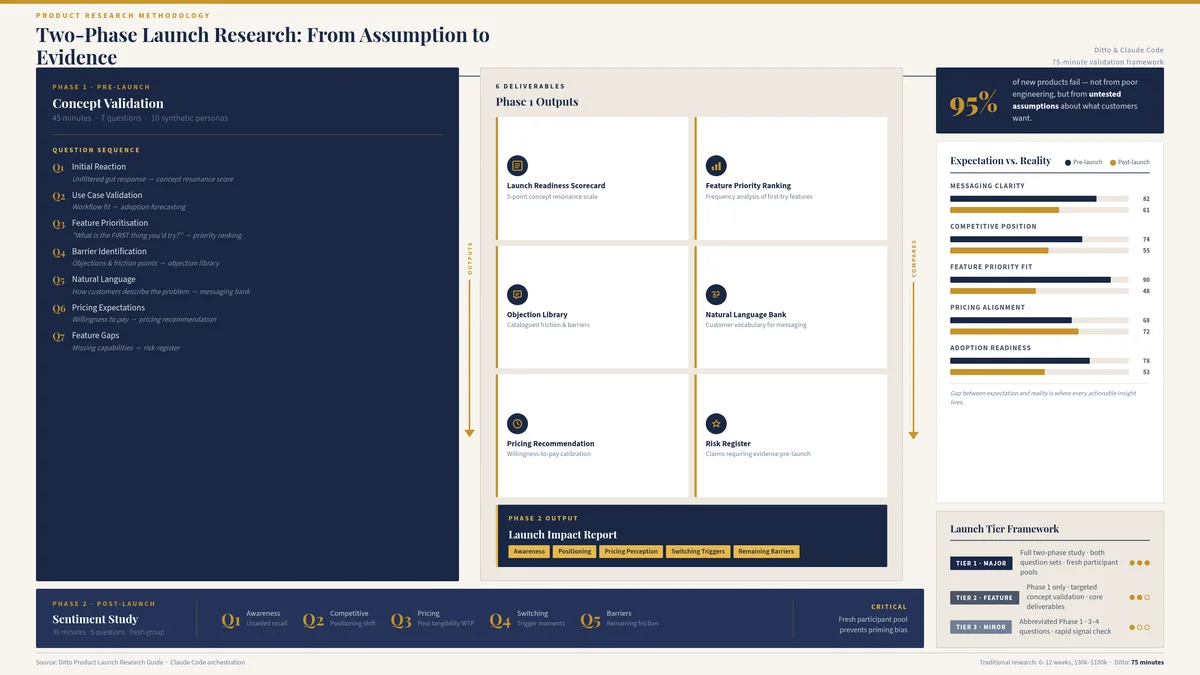
Clayton Christensen's often-cited statistic is that 95% of new products fail. The precise number is debatable. Some researchers place it at 80%, others at 90%, and Christensen himself acknowledged the figure was an estimate rather than a rigorous measurement. But the direction is unambiguous, and it has been unambiguous for decades. Most product launches fail. Not because the product is technically deficient, not because the engineering team cut corners, and not because the market does not exist. They fail because the market was not consulted in time. The product was built on assumptions about what customers want, how they describe their problems, what they would pay, and which features matter most. Those assumptions went untested until the launch itself became the experiment.
The cost of this failure pattern is not merely financial, though the financial cost is considerable. It is temporal. Traditional pre-launch research takes six to twelve weeks and costs $30,000 to $100,000 for a properly constructed study with screened participants, moderated interviews, and synthesised findings. At that price and timeline, most product teams skip it entirely. They substitute internal conviction for external validation, ship the product, and discover the gap between their assumptions and reality in the most expensive way possible: through poor adoption, confused messaging, and a launch that lands with a thud.
Ditto's two-phase launch research approach compresses weeks of validation into approximately seventy-five minutes. Phase 1 is a pre-launch concept validation study (forty-five minutes, seven questions). Phase 2 is a post-launch sentiment study (thirty minutes, five questions). The comparison between the two reveals the gap between expectation and reality, which is where every actionable insight lives. For a detailed walkthrough of how Claude Code orchestrates Ditto studies, see the Product Launch Research Guide.
The Two-Phase Approach
Most launch research treats the launch as a single event: research before, launch, measure after. The problem with this framing is that it conflates two fundamentally different questions. Before launch, the question is: will this resonate? After launch, the question is: did this resonate? These require different research designs, different participant pools, and different analytical frameworks.
Phase 1 (pre-launch) uses a seven-question concept validation study. Ten synthetic personas, recruited to match the target customer profile, respond to questions about initial reaction, use case fit, feature priorities, barriers, natural language, pricing expectations, and feature gaps. The study takes approximately forty-five minutes from group creation to completed insights. It produces six deliverables: a Launch Readiness Scorecard, a Feature Priority Ranking, an Objection Library, a Natural Language Bank, a Pricing Recommendation, and a Risk Register.
Phase 2 (post-launch) uses a five-question sentiment study with a fresh research group. This is critical. The same participants who evaluated the concept pre-launch are now primed. They have already formed opinions about the product based on a description rather than experience. A fresh group provides uncontaminated post-launch perception. The five questions measure awareness, competitive positioning, pricing perception, switching triggers, and remaining barriers. Phase 2 takes approximately thirty minutes and produces a Launch Impact Report.
The power of the two-phase approach is not in either study individually. It is in the comparison. The gap between pre-launch expectations and post-launch reality reveals messaging problems (the product was described one way but experienced another), positioning problems (the competitive frame shifted), feature priority misalignment (the hero feature is not what customers actually use first), and pricing miscalibration (willingness to pay changed once the product was tangible).
Phase 1: The Seven Pre-Launch Questions
The pre-launch study follows a deliberate sequence. Each question builds on the previous one, moving from emotional reaction to rational evaluation to creative contribution. The order matters because it mirrors the actual customer journey: first impression, then consideration, then objection, then decision.
Q1: Initial Reaction
"When you first hear about [product], what comes to mind?" This is the unfiltered gut response before rational evaluation takes over. It reveals whether the concept triggers curiosity, confusion, scepticism, or excitement. The responses feed directly into the Launch Readiness Scorecard, scored on a five-point scale for concept resonance. They also populate the Risk Register: if multiple personas express scepticism about a specific claim, that claim needs evidence before launch. This question draws on the same instinctive reaction methodology used in message testing, where first impressions predict downstream engagement.
Q2: Use Case Validation
"How would this fit into your current workflow or routine?" This tests whether enthusiasm translates to adoption. A product can generate excitement in the abstract and still fail to find a home in someone's daily life. The gap between "this sounds interesting" and "I would use this on Tuesday mornings" is where many launches die. Responses reveal whether the product slots into an existing behaviour or requires a new one, which has profound implications for go-to-market strategy and adoption forecasting.
Q3: Feature Prioritisation
"What is the FIRST thing you would try?" Not the most important feature. Not the feature they would use most. The first. This distinction matters because the first feature a customer tries determines their initial experience, and initial experience determines whether they stay. The responses produce a Feature Priority Ranking based on frequency analysis, which often diverges from the product team's assumptions about what matters most. Cross-referencing Q3 responses with Q7 (feature gaps) reveals whether the most-desired features are the ones being shipped.
Q4: Barrier Identification
"What would stop you from trying this?" The most valuable question in the study, and the one product teams are most reluctant to ask. Barriers fall into six categories: Trust ("I do not know this brand"), Price ("too expensive for what it offers"), Complexity ("looks difficult to set up"), Switching ("I already use something similar"), Competition ("why not just use [competitor]?"), and Missing Feature ("it does not do [X]"). Each barrier is catalogued in the Objection Library with frequency counts, severity ratings, and pre-drafted responses. This is the direct input to sales enablement materials: every objection a sales team will encounter is surfaced before the product ships.
Q5: Natural Language Capture
"How would you describe this product to a colleague in one sentence?" This is a marketing copy goldmine. It reveals the language real people use to describe the product, which is almost never the language the marketing team uses. Recurring phrases become headline candidates. Words that appear across multiple personas signal resonance. Words that appear in concerning contexts signal messaging risk. The Natural Language Bank produced by this question feeds directly into positioning and messaging work, providing customer-validated language rather than internally generated copy.
Q6: Price Anchoring
"What would you expect to pay for this? At what price would it feel like a steal? At what price would it feel too expensive?" Three data points per persona, thirty data points per study. The medians define the acceptable pricing range. The distance between "steal" and "too expensive" indicates price sensitivity. A narrow range suggests the market has a clear mental model for what this type of product should cost. A wide range suggests the category is new and pricing is up for grabs, which is an advantage if exploited correctly. This question produces the Pricing Recommendation and connects directly to pricing research methodology.
Q7: Feature Gaps
"If you could add or change one thing about this product, what would it be?" The final question shifts participants from evaluator to collaborator. It surfaces features the product team had not considered, refinements to existing features, and integration requirements. These responses feed into the post-launch roadmap and, when cross-referenced with Q3 (feature prioritisation), reveal whether the product's current feature set aligns with what customers actually want first. Gap features that appear with high frequency become candidates for the first post-launch update.
Six Launch Readiness Deliverables
The seven questions produce six structured deliverables. Each serves a different audience and a different decision.
1. Launch Readiness Scorecard
A quantified assessment of whether the product is ready to launch. Four dimensions scored on a five-point scale: Concept Resonance (derived from Q1), Use Case Clarity (Q2), Feature Alignment (Q3), and Descriptive Clarity (Q5). The overall score determines the recommendation: 4.0 and above means ready to launch, 3.0 to 3.9 means conditional (launch with specific mitigations), and below 3.0 means reconsider the launch timing or the product itself. This is the single most important deliverable for the launch decision.
2. Feature Priority Ranking
A frequency-based ranking of which features customers want to try first (Q3), which features fit their workflow (Q2), and which features are missing (Q7). The ranking often surprises product teams because the feature they invested the most engineering effort in is rarely the feature customers are most excited about. The gap between internal priority and customer priority is one of the most common sources of launch failure.
3. Objection Library
A categorised catalogue of every barrier surfaced in Q4, organised by type (Trust, Price, Complexity, Switching, Competition, Missing Feature), with frequency counts across all ten personas and pre-drafted responses. This deliverable goes directly to the sales team, the customer success team, and the FAQ page. Every objection that will arise in the first month of launch is documented before the product ships.
4. Natural Language Bank
Verbatim one-sentence descriptions from Q5, organised by recurring phrases, headline candidates, resonant words (appear positively across multiple personas), and concerning words (appear in negative or confused contexts). This deliverable goes to the marketing team for launch copy, landing page headlines, ad creative, and social media messaging. It replaces the common practice of writing marketing copy in a conference room and hoping it sounds like something a customer would say.
5. Pricing Recommendation
Median values for expected price, steal price, and too-expensive price (Q6), the acceptable range between steal and too-expensive, and a recommended launch price positioned within that range. The recommendation accounts for competitive anchoring (where competitors are priced relative to the acceptable range) and value perception (whether the product's perceived value supports a premium position or demands a penetration price).
6. Risk Register
A likelihood-by-impact matrix populated from Q1 (scepticism signals), Q4 (barriers), and Q7 (missing features). Risks are tiered as Critical (high likelihood, high impact), Moderate (mixed), or Low (unlikely or low impact), and colour-coded GREEN, AMBER, or RED. The Risk Register is not a document to be filed. It is an action plan: each Critical risk requires a mitigation strategy before launch, and each AMBER risk requires a monitoring plan.
Phase 2: Post-Launch Sentiment
Phase 2 runs one to four weeks after launch, depending on the product's adoption curve. The study uses a fresh research group, not the same personas from Phase 1. Fresh participants provide unprimed reactions to the product as it actually exists in the market, not as it was described in a concept study.
The five post-launch questions measure different dimensions from the pre-launch study, but they are designed to enable direct comparison.
Awareness and First Impression: "Have you heard of [product]? What is your impression?" Measures whether launch awareness is penetrating the target market and whether the impression matches the intended positioning. Compare with Q1 from Phase 1: is the reaction consistent, better, or worse when people encounter the real product versus the concept?
Competitive Positioning: "How does this compare to [competitor/current solution]?" Reveals whether the product's competitive frame is landing as intended. The competitive intelligence generated pre-launch should predict these responses. If it does not, the competitive positioning needs revision.
Pricing Perception: "Does the price feel fair for what you get?" A simpler question than the three-part Q6 from Phase 1 because post-launch participants can evaluate price against a real product, not a concept. Compare with the Phase 1 Pricing Recommendation: is the launch price landing within the acceptable range?
Switching Triggers: "What would make you switch from your current solution to this?" Identifies the specific conditions under which adoption occurs. These triggers become the focus of content marketing and targeted campaigns.
Remaining Barriers: "What is still holding you back from trying this?" The post-launch version of Q4. Barriers that appeared pre-launch may have been resolved by the actual product experience. New barriers may have emerged. The comparison reveals which objections were overblown in concept testing and which persisted or worsened.
The Launch Impact Report
The Launch Impact Report is the comparison deliverable. It places Phase 1 expectations alongside Phase 2 reality across five dimensions and highlights the gaps. The gaps, not the absolute scores, are where the actionable insights live.
Resonance: Did the excitement from Q1 materialise in post-launch awareness and impression? If Phase 1 showed strong concept resonance but Phase 2 shows weak awareness, the launch messaging or distribution failed, not the product.
Features: Is the hero feature from Q3 the one customers are actually trying first post-launch? If the feature priority shifted, the onboarding experience may need restructuring to guide users toward the highest-value feature.
Barriers: Were the Q4 objections overblown in concept testing, or were they confirmed post-launch? Overblown barriers mean the product experience resolved them (good news). Confirmed barriers mean the Objection Library needs immediate deployment to sales and customer success.
Pricing: Is the post-launch price perception holding within the Phase 1 acceptable range? If post-launch participants perceive the price as too high despite Phase 1 showing willingness, the value communication is failing, not the price itself.
Language: Are post-launch customers describing the product using the same language as Phase 1 participants? Divergence here reveals a messaging gap: the way people talk about the product after using it differs from the way they describe it from a concept description. The post-launch language should replace the pre-launch language in all marketing materials.
Launch Tiering: Matching Research to Launch Scale
Not every launch warrants the full two-phase, twelve-question research programme. Over-researching minor updates wastes time without meaningfully reducing risk. Under-researching major launches is how products fail. The solution is tiering.
Tier 1: Major Launch
A new product, a new market entry, a significant pivot, or a launch where the company's reputation and revenue trajectory depend on the outcome. Tier 1 launches receive the full treatment: seven pre-launch questions, five post-launch questions, all six deliverables, and a comprehensive Launch Impact Report. Time investment: approximately seventy-five minutes of research across two phases, plus analysis. This is the approach described in detail throughout this article.
Tier 2: Feature Launch
A significant new feature, a major redesign, or a pricing change within an existing product. The core product is already validated; the question is whether the change improves the experience. Tier 2 launches use a focused four to five question pre-launch study (Q1, Q3, Q4, Q6, optionally Q7) and a reduced set of three to four deliverables (Launch Readiness Scorecard, Feature Priority Ranking, Objection Library, Pricing Recommendation). Phase 2 may be skipped if post-launch data is available from product analytics.
Tier 3: Minor Update
A small feature addition, a UI refinement, a copy change, or a minor pricing adjustment. Tier 3 launches use a quick two to three question concept check (typically Q1 and Q4, optionally Q5) to validate that the change does not introduce unexpected confusion or objections. No formal deliverables; the study output itself is sufficient. Total time: approximately fifteen minutes.
Where Product Launch Research Fits in the PMM Stack
Product launch research is the capstone of the product marketing stack. It does not exist in isolation. It draws from, and validates, every other PMM discipline. A launch that fails to integrate these upstream inputs is flying blind regardless of how good the launch study itself might be.
Positioning: Is the frame right? The Launch Readiness Scorecard (Q1) directly tests whether the positioning resonates. If concept resonance is low, the problem is almost always positioning, not the product.
Messaging: Does the language land? The Natural Language Bank (Q5) reveals whether customers describe the product using the words the marketing team chose. If they do not, the messaging needs revision before launch.
Pricing: Is the price anchored? The Pricing Recommendation (Q6) validates or challenges the pricing strategy. A launch with misaligned pricing is a recoverable error, but an expensive one.
Segmentation: Which segment to launch to first? The beachhead segment identified through segmentation research determines the target audience for Phase 1 and Phase 2 studies. Launching to the wrong segment produces misleading research and poor adoption.
Competitive Intelligence: How to position against alternatives? Q4 (barriers) and Phase 2's competitive positioning question reveal whether the competitive frame is landing. Battlecards should be updated with post-launch competitive perception data.
Voice of Customer: What do customers actually want? VoC research conducted before the launch study informs the product concept being tested. Q7 (feature gaps) in the launch study surfaces new VoC data that feeds back into the product roadmap.
GTM Strategy: Which motion to use? The launch study validates the GTM assumptions: Q2 (use case) reveals whether the product requires a sales-led or product-led motion, and Phase 2 switching triggers reveal the most effective acquisition channels.
Sales Enablement: Is the sales team armed? The Objection Library (Q4) is the single most valuable input to sales enablement. Every objection documented pre-launch becomes a battlecard, an FAQ entry, or a talk track before the first sales conversation occurs.
Content Marketing: Is the launch content ready? The Natural Language Bank (Q5) provides customer-validated language for launch blog posts, landing pages, email campaigns, and social media. Phase 2 switching triggers inform the editorial calendar for the first quarter post-launch.
This interconnection is why launch research should be the last PMM study conducted, not the first. Teams that jump straight to launch research without having done positioning, segmentation, and pricing work are asking the right questions at the wrong time. The launch study validates and integrates prior research. It does not replace it.
Limitations
Pre-launch validation tests concept resonance, not actual purchasing behaviour. The gap between "I would try this" and "I paid for this" is real, and no amount of synthetic research eliminates it. Personas report stated intent with high fidelity (EY Americas and Harvard/Cambridge/Oxford studies demonstrate 95% correlation with real participant responses), but stated intent is not the same as revealed preference. A persona who says "I would pay $29 per month" is expressing a genuine attitude. Whether they would actually enter their credit card details at that price is a separate question that only real-world data can answer.
Phase 2 measures perception, not usage. Post-launch participants report how they perceive the product, its pricing, and its competitive position. They do not report actual usage patterns, session frequency, feature adoption rates, or churn risk. Product analytics, CRM data, and cohort analysis remain essential for measuring actual adoption and retention. The launch study tells you why customers feel the way they do. Product analytics tell you what they actually do. Both are necessary.
Finally, the two-phase approach assumes a gap between launch and Phase 2 research. For products with extremely rapid adoption curves (viral consumer apps, for example), the window between launch and meaningful post-launch sentiment may be narrow. In such cases, Phase 2 should be conducted within one to two weeks rather than the standard two to four weeks.
Getting Started
Two phases. Seventy-five minutes. Six deliverables. One comparison report that reveals the gap between what you expected and what happened.
Phase 1 answers the question every product team asks before launch: will this work? Phase 2 answers the question every product team should ask after launch: did this work the way we expected? The Launch Impact Report answers the question that actually matters: what do we do now?
The Product Launch Research Guide provides a step-by-step walkthrough of the complete two-phase workflow, from research group creation through to the final Launch Impact Report. The series overview covers the full product marketing stack.
The Claude Code and Ditto for Product Marketing Series
This article is part of a series on using Claude Code and Ditto for product marketing. Each article explains a specific workflow; each has a corresponding Claude Code technical guide for hands-on implementation.
Part 1: How to Validate Product Positioning with Claude Code and Ditto | Claude Code Guide
Part 2: How to Build Competitive Battlecards with Claude Code and Ditto | Claude Code Guide
Part 3: How to Research Pricing with Claude Code and Ditto | Claude Code Guide
Part 4: How to Test Product Messaging with Claude Code and Ditto | Claude Code Guide
Part 5: How to Run Voice of Customer Research with Claude Code and Ditto | Claude Code Guide
Part 6: How to Segment Customers with Claude Code and Ditto | Claude Code Guide
Part 7: How to Validate GTM Strategy with Claude Code and Ditto | Claude Code Guide
Part 8: How to Build a Content Marketing Engine with Claude Code and Ditto | Claude Code Guide
Part 9: How to Build Sales Enablement with Claude Code and Ditto | Claude Code Guide
Part 10: How to Research a Product Launch with Claude Code and Ditto (this article) | Claude Code Guide